Today
The modern Herschel-experiment
The basic experimental setup for the discovery and the detection of the infrared radiation within sunlight is the same today as it was back in the year 1800. Nevertheless, today we can use much more precise instruments and material, and some parts of the experiment can be modified and "modernised".
The prism

Image 1: prism mounted on a tripod

Image 2: prism mount made of Lego
The prism
For the experiment we use a simple three-sided prism with a length of approximately 20 cm, which we attach to a mount and put it into sunlight. To achieve a sharper spectrum, where the different colours of the rainbow are easier to distinguish, we place a mask on the side of the prism closest to the sun, and create a slit with this mask. Sunlight can only enter through this slit and will be diffracted through the prism.
The mounting of the prism can be done in different ways. In principle, one could also hold the prism with a still hand, but then the spectrum, in which one wants to do precise measurements later on, will nevertheless move and jitter. Therefore, it is better to attach the prism to a fixed mount, for example a clip or a tripod (see approximately Image 1). But there are ample possibilities to let creative ideas run wild and build a personal mount! We already did the experiment with a prism mount built out of Lego (see Image 2). The only important thing is that the prism has to be adjustable in such a way that in the end the rainbow or created spectrum can be projected on a smooth surface on the floor or a table.
Attention! If one is conducting this experiment over a long time, then of course also the solar altitude will change - the prism should always be in direct sunlight during the experiment and the setup should be adjustable for the solar motion, if it once happens to be in the shade.
The spectrum
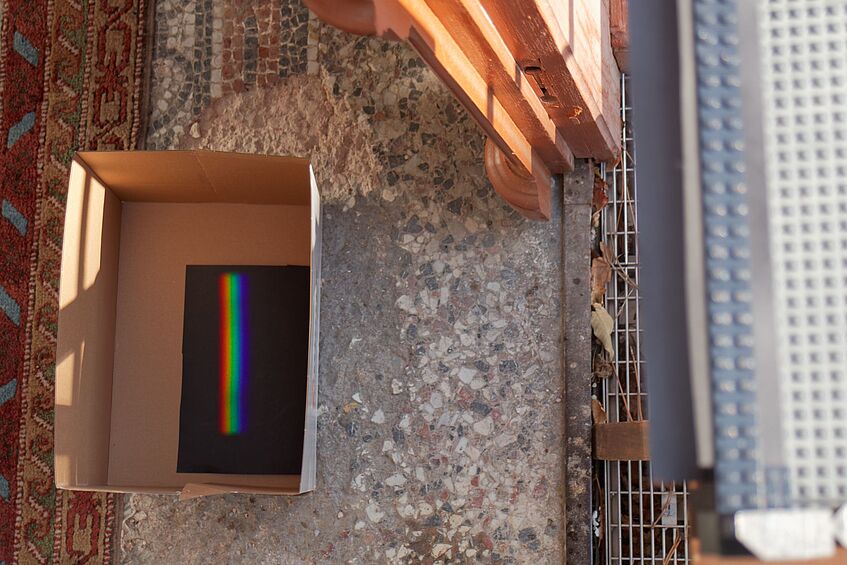
Image 3: The spektrum
The spectrum
The spectrum produced by the prism should be projected on a smooth, continuous surface to ensure constant and manageable measurement conditions for the temperature measurement. Additionally, the spectrum should be projected to a shady area to reduce interfering solar radiation. For the projection of the spectrum we have used an open cardboard box, standing on the floor, and creating shade for the inside of the box (Image 3).
Tip: A black sheet of paper as projection surface is heating up easier, when measuring the temperatures with an infrared camera.
The temperature measurement
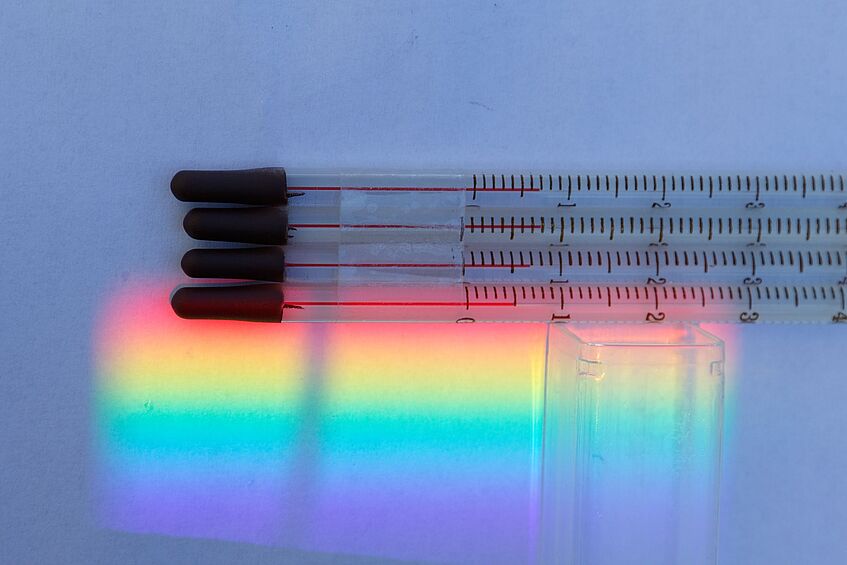
Image 4: thermometers with low temperature resolution at low ambient temperature
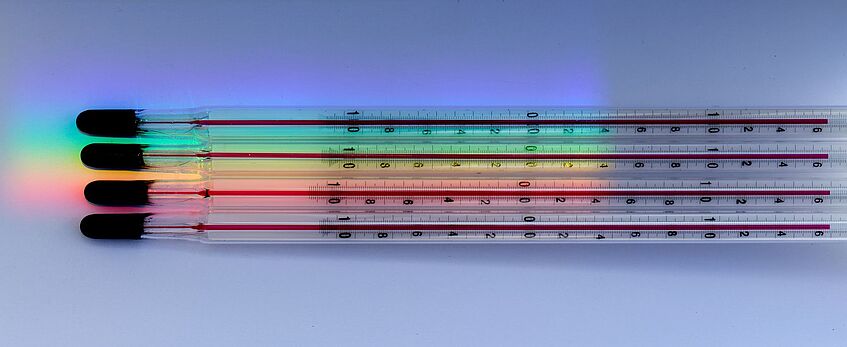
Image 5: thermometers with high temperature resolution at slightly higher ambient temperature
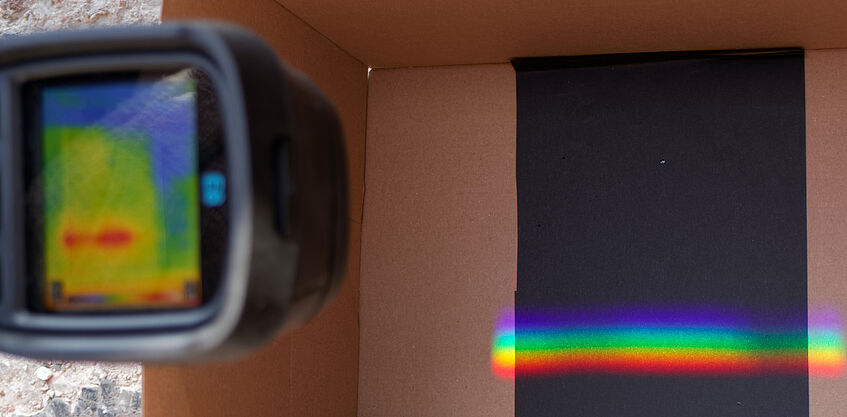
Image 6: temperature measurement with the infrared camera
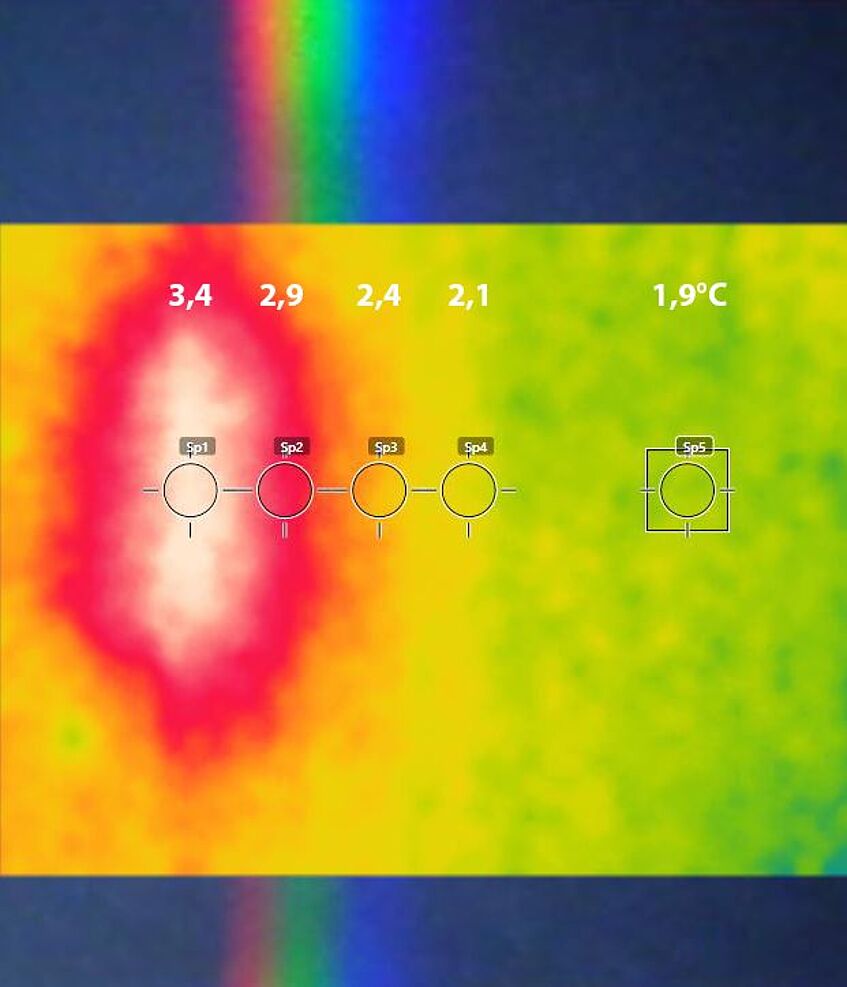
Image 7: temperature evaluation of the image taken by the infrared camera
The temperature measurement
As soon as the prism is places and the spectrum is projected, the temperatures of the different spectral colours can be measured. One can use simple thermometers like in the original experiment, as long the temperature scale is sufficiently fine. It is of advantage to use thermometers with blackened tips, which absorb the incoming radiation more efficiently. We have conducted the experiment with two different types of thermometers and during different ambient temperatures. Image 4 shows the measurement with a thermometer with low temperature resolution and at low ambient temperature (around 5°C). The focus here is put on the direct measurement of infrared radiation. Image 5 shows a measurement with thermometers with a finer temperature scale at slightly higher ambient temperature (around 16°C).
The development of modern technology makes it possible to directly image infrared radiation. This is done with an infrared camera. Infrared cameras directly display temperatures in a colour scale to optically depict temperature differences. Additionally, they store the measured temperature of each pixel in the image and allow exact temperature measurements at any point in the image. We use a commercially available infrared camera to analyse the spectrum (Image 6). Image 7 shows the evaluation of the recorded image, where several measurement points are set throughout the spectrum. The optical image of the spectrum is seen in the background as reference. The maximum temperature of the spectrum, depicted by white and red regions in the infrared image, is clearly seen left of the red part of the optical spectrum.
Attention! The temperature differences in the different spectral colours and the infrared region are very small, meaning only a fraction of one degree Celsius.
Tip: It is easier to conduct the experiment during not too high ambient temperature, for example during winter or spring/autumn outdoors. Then the temperature difference between ambient temperature and spectrum is easier to measure.
To additional experiments on the topic of infrared radiation